Plot predictions from mapbayests object
Arguments
- x
A
mapbayestsobject.- ...
additional arguments (passed to
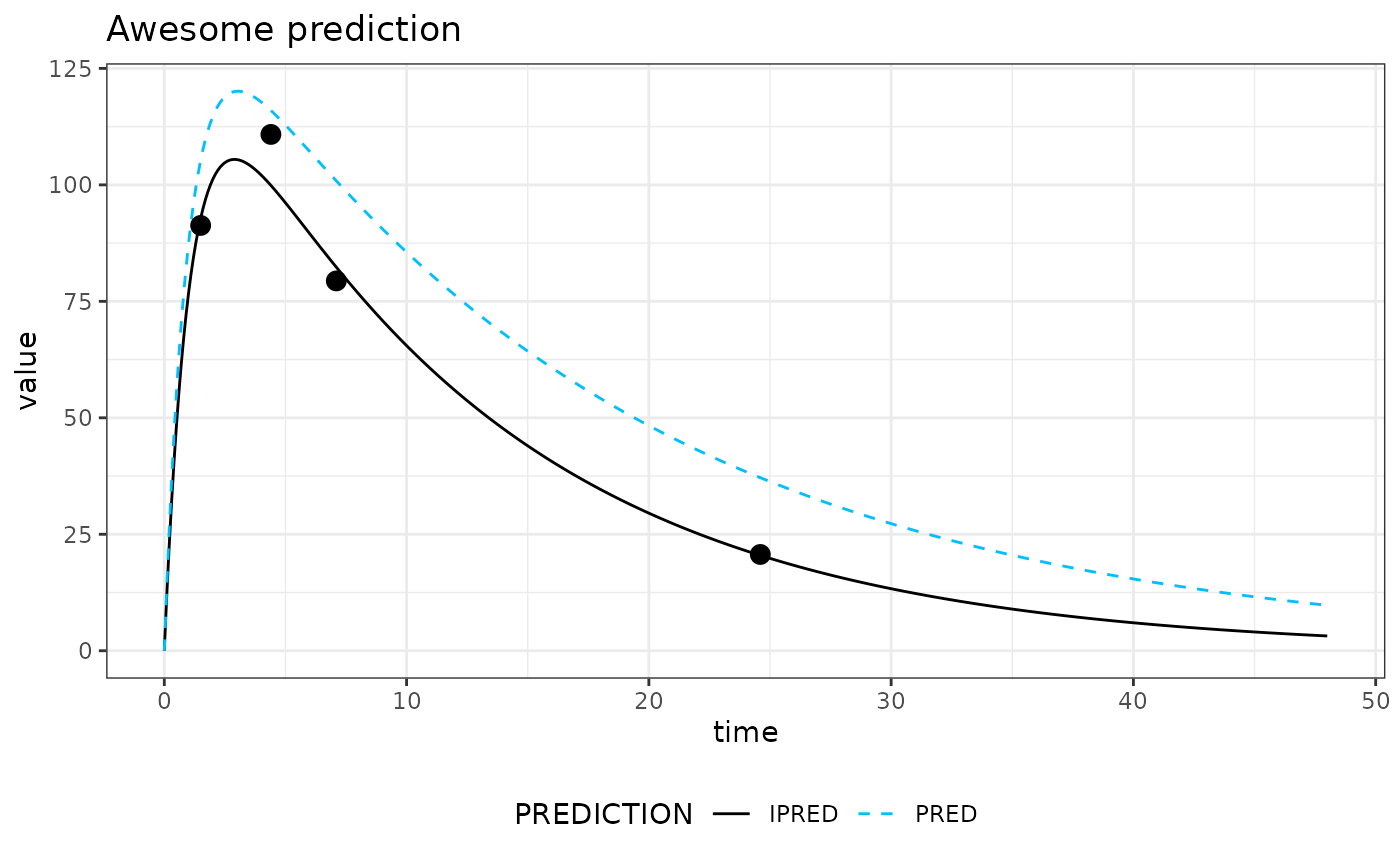
augment.mapbayests)- PREDICTION
plot either "IPRED", "PRED" or both.
Details
Use this function to plot the results of the estimations, in the form of concentration vs time profiles for every patient of the data set. For additional modifications, you can:
see
augment.mapbayeststo modify the simulation output.add extra
+function(...)in order to modify the plot as a regularggplot2object.